
Roofers, painters, solar installers and insurers all start with the same question: how big is this roof, and how steep? The usual answer is a site visit, or a guess from a satellite photo that can't see pitch.
While building the Lemira roof quote, I measured every roof in Canterbury in advance from LINZ aerial survey data. That engine turned out to be useful well beyond one painter's website, so I've opened it up as an API.
Impact
- Canterbury roofs measured and ready to serve
- 433,572
- Districts covered, from Kaikōura to Waimate
- 9
- High-confidence pitches confirmed by a second survey, within 3°
- 94%
- Endpoints: roofs, addresses, buildings and coverage
- 4
What it returns
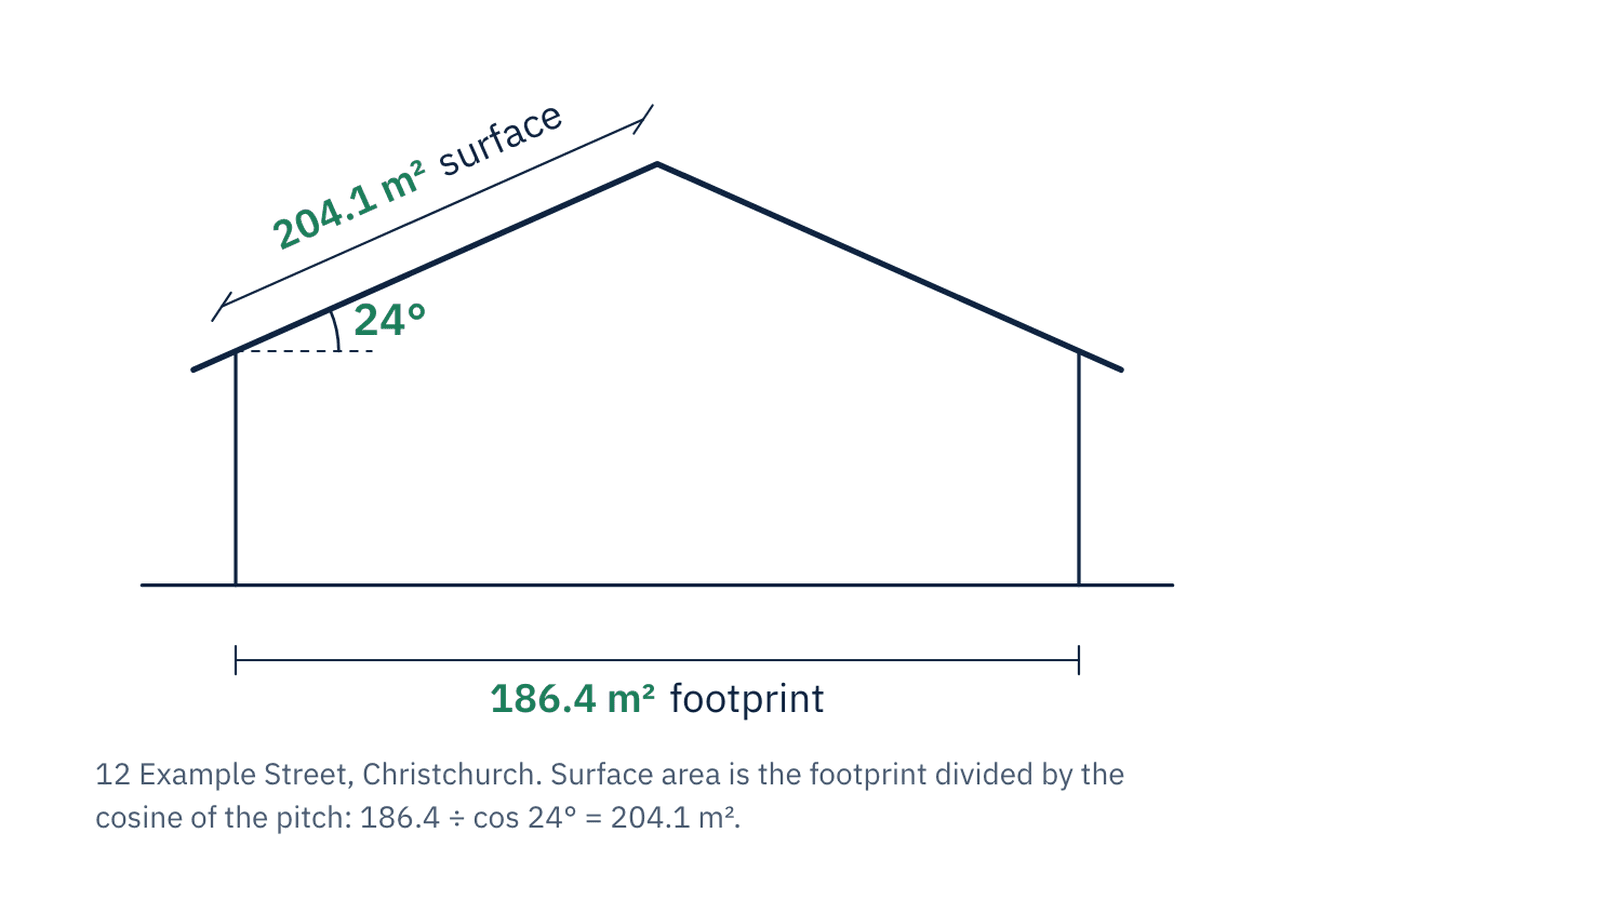
Send a street address. Back comes the building footprint in square metres, the roof pitch in degrees, the true surface area, and a confidence rating for the pitch. The surface area is the footprint divided by the cosine of the pitch, and every number traces back to open government data. No model guesses a measurement.
Written for developers, and for the assistants helping them
The site is as much of the product as the endpoints. Before anyone integrates an API, they ask the same things: what does it return, what does it cost per call, how is it rate limited, what happens when it fails. So the site answers all of it in plain text: every endpoint with an example response, rate limits per key, every error code and whether it's safe to retry, and a FAQ. The same content is published as an OpenAPI 3.1 document and an llms.txt, generated from one source so the page, the spec and the schema markup can never disagree.
How it's sold
Canterbury is live today. The rest of New Zealand follows wherever LINZ has flown LiDAR, region by region, starting with the regions people ask for most. Access is by arrangement through Product in Your Pocket rather than self-serve, so every integration starts with a conversation about volume and coverage.
Built on open data from LINZ, used under CC BY 4.0.